
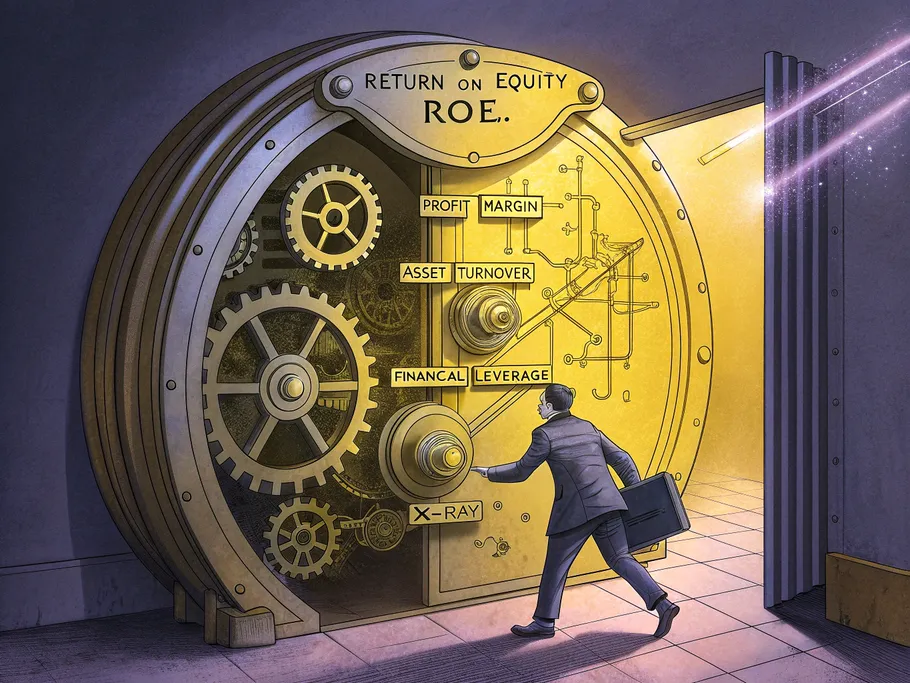
The DuPont analysis is a classic financial analysis tool, but don’t let its age fool you. Developed way back in the 1920s, it’s a powerful method for dissecting a company’s Return on Equity (ROE) into its core drivers. Think of it as a financial X-ray, letting you see what’s really going on beneath the surface.
This breakdown allows you to pinpoint whether a company’s performance comes from killer profitability, operational genius, or just a boatload of debt. For instance, a company might flash a high ROE, but a quick DuPont analysis could reveal it’s all thanks to high financial leverage – a clear red flag for risk.
So, What is DuPont Analysis, Really?
At its heart, the DuPont analysis is a framework that says, “Don’t just look at the final number.” It breaks down ROE to identify a company’s specific strengths and weaknesses.
Instead of just seeing a single ROE percentage, you get to see the three levers that produced it. It’s the difference between knowing your car is fast and knowing it’s fast because of the engine, the aerodynamics, or the fact that you’ve stripped out the back seats.
The Three Core Components of DuPont Analysis
The DuPont analysis formula dissects ROE into three make-or-break components:
- Profit Margin: This is your profitability pulse-check. It measures how much profit you squeeze out of every dollar in sales. It’s calculated as Net Profit / Total Revenue and reflects your pricing power and cost control.
- Total Asset Turnover: This is your efficiency engine. It shows how effectively you’re using your assets to generate revenue. Calculated as Revenues / Average Assets, a higher number means you’re getting more bang for your asset buck.
- Financial Leverage: This is the turbo-charger… and the potential time bomb. Calculated as Average Assets / Average Equity, it shows how much of the company is financed by debt versus equity. Using debt can juice up your ROE, but remember – you’re just magnifying your risk until you’re leveraged straight into oblivion.
By looking at these three together, you get a much smarter, more nuanced picture of a company’s performance.

The DuPont Analysis Formula
You can run this analysis using two main models. The 3-step is the classic, and the 5-step is for when you’re feeling extra spicy.
The 3-Step DuPont Analysis Formula
This is the foundational formula that ties the three components together:
ROE = Net Profit Margin × Total Asset Turnover × Financial Leverage
Simple, elegant, and powerful. It shows exactly how profitability, asset efficiency, and leverage team up to create the final return on equity.
The 5-Step DuPont Analysis Formula
For a more granular view, the 5-step DuPont analysis breaks things down even further by separating the tax and interest components. It considers Earnings Before Interest and Taxes (EBIT) and the company’s tax rate.
ROE = (EBIT / Total Revenue) × (Total Revenue / Average Total Assets) × (Average Total Assets / Average Shareholders’ Equity) × (1 – Tax Rate)
This version gives you a more detailed look at operational efficiency before the effects of taxes and financing decisions.
DuPont Analysis Examples in Action
Let’s stop talking theory and look at some real numbers. Here are a few DuPont analysis examples to show you how it works.
Organization X Example
Here’s the financial data for Organization X:
- Net Income: $72,000
- Net Sales: $420,000
- Total Assets: $473,000
- Total Shareholders Equity: $358,000
Let’s calculate:
- Profit Margin = $72,000 / $420,000 = 17.14%
- Asset Turnover = $420,000 / $473,000 = 0.89
- Equity Multiplier = $473,000 / $358,000 = 1.32
ROE = 17.14% × 0.89 × 1.32 = 20.14%
This means Organization X generates about $0.20 in profit for every dollar of equity invested.
Walmart (WMT) Example
For the fiscal year ending January 31, 2021:
- Net Income: $4.75 billion
- Revenue: $559.2 billion
- Assets: $252.5 billion
- Shareholders’ Equity: $80.9 billion
Let’s calculate:
- Profit Margin = $4.75 / $559.2 = 0.85%
- Asset Turnover = $559.2 / $252.5 = 2.21
- Equity Multiplier = $252.5 / $80.9 = 3.12

ROE = 0.85% × 2.21 × 3.12 = 5.87%
Walmart’s profit margin is razor-thin, but its incredible asset turnover and significant leverage combine to produce its ROE.
ABC Co. Example
Financial Information:
- Net Income: $50,000
- Revenues: $300,000
- Total Assets: $900,000
- Shareholders’ Equity: $150,000
Let’s calculate:
- Profit Margin = $50,000 / $300,000 = 16.67%
- Asset Turnover = $300,000 / $900,000 = 0.33
- Equity Multiplier = $900,000 / $150,000 = 6.00
ROE = 16.67% × 0.33 × 6.00 = 33.33%
Danny Ltd. Example
Using the 5-step model for 2020-2021 data (and assuming a 30% tax rate):
- EBIT: $1,200,000
- Net Sales: $9,600,000
- Gross Assets: $7,000,000
- Equity Share Capital: $5,000,000
ROE = ($1,200,000 / $9,600,000) × ($9,600,000 / $7,000,000) × ($7,000,000 / $5,000,000) × (1 – 0.30) = 22.4%
Pros and Cons of DuPont Analysis
Like any tool, it has its perks and its quirks.
Pros:
- Pinpoints Strengths and Weaknesses: It tells you why your ROE is what it is.
- Provides Actionable Insights: Helps you figure out if you need to fix pricing, manage assets better, or rethink your debt.
- Great for Comparisons: Makes it easy to compare similar companies and see who is truly performing better.
Cons:
- Garbage In, Garbage Out: The analysis is only as good as the financial data. It can be skewed by accounting tricks.
- Industry-Specific: It’s not great for comparing a tech company to a railroad. You need to compare apples to apples.
- Size Matters: Works best when comparing companies of a similar size.
Applications of the DuPont Formula

- Predicting Trends: Gives you insight into future performance by analyzing the components of Return On Net Operating Assets (RNOA).
- Industry Benchmarking: Standardized metrics make it perfect for seeing how you stack up against the competition.
- Finding Efficiency: Pinpoints exactly where you can make changes to boost profits.
The Limitations of DuPont Analysis
Now for the fine print. Don’t get it twisted – this isn’t a magic eight-ball.
- It has a short-term focus and doesn’t account for things like the cost of capital or the time value of money.
- It completely ignores the economic value a company generates.
- It’s tough to set clear benchmarks for Return on Capital Employed (ROCE).
- It uses gross assets instead of net value. That’s not just contradicting accounting principles; it’s actively living in a financial fantasy.
The Final Word
The DuPont formula is a killer tool for any serious financial analysis. It rips apart the Return on Equity to show you the gears turning underneath – the profitability, efficiency, and leverage that drive a company’s results.
While it has its limitations, it forces you to ask better questions and understand a business on a deeper level. When used wisely, especially for comparing companies in the same industry, it remains one of the most powerful frameworks for making smarter investment decisions.