
Alright, let’s cut through the financial jargon and get straight to the point: an income statement is like your business’s personal scoreboard. It tells you whether you’re raking in the cash or burning through it faster than a startup on launch day. Also known as the profit and loss statement (P&L), this document is your ticket to understanding the financial health of your company.
In this deep dive, we’ll break down income statements, sprinkle in some humor to keep things lively, and arm you with the knowledge to read, prepare, and analyze these bad boys like a pro. We’ll cover the differences between the income statement and other financial statements like the balance sheet and cash flow statement. Buckle up; it’s time to make numbers fun!

What Is an Income Statement?
Think of an income statement as the Netflix of your business’s financial performance—it’s a streaming account of your revenues, expenses, gains, and losses over a specific period, like a fiscal quarter or year. Unlike your favorite show, though, this isn’t something you want to binge in one sitting at the last minute before tax season.
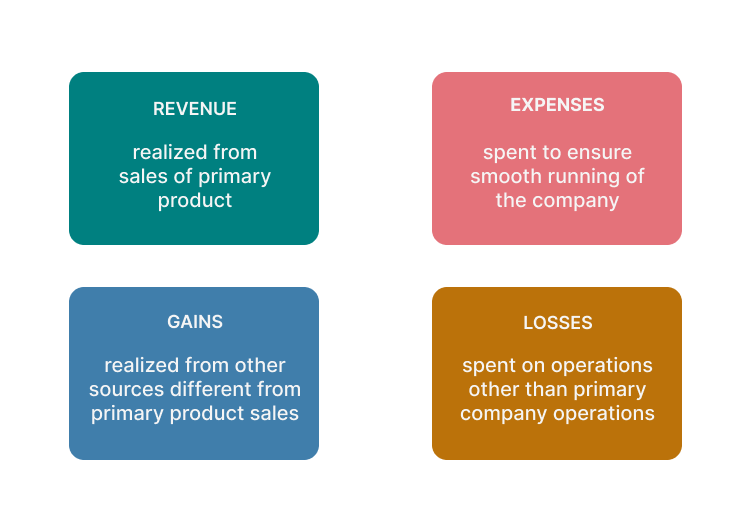
The income statement shows:
- Revenues: Money coming in from sales of goods or services.
- Expenses: Money going out to keep the business running.
- Gains: Extra money from non-core business activities.
- Losses: Money lost from activities outside regular operations.
Investors and creditors love peeking at your income statement because it reveals whether your business is profitable or if you’re just throwing cash into a black hole. It’s like the financial X-ray of your company—no hiding those sneaky expenses!
Other Names for the Income Statement
The income statement goes by many aliases (no, it’s not on the run from the law). You might hear it called:
- Profit and Loss Statement (P&L)
- Statement of Revenue and Expense
- Statement of Financial Performance
- Statement of Operations
- Earnings Statement
- Statement of Earnings
Whatever you call it, the income statement serves the same purpose: showing you the money (or lack thereof).
Why Is the Income Statement Important?
So, why should you care about the income statement? Well, unless you enjoy flying blind with your finances, this document is crucial because:
- It helps predict future performance: Past trends can hint at future profits or losses. It’s like your business’s financial crystal ball—minus the hocus-pocus.
- It informs business decisions: Seeing where you earn and spend helps you tweak strategies, cut costs, or double down on what’s working.
- It shows financial health: A positive net income suggests your business is healthy. Negative net income? Time to reevaluate those expenses, my friend.
Why Is the Income Statement Prepared?
Preparing an income statement isn’t just a tedious accounting chore (though accountants might disagree). It’s prepared because:
- Investors need it: They want to see if your business is worth their money or if it’s a sinking ship.
- Business owners need clarity: It reveals trends in revenue and expenses, helping you make informed decisions.
- It’s legally required: Yep, the taxman demands it. Ignoring this is like ignoring a toothache—it won’t end well.
Components of an Income Statement
An income statement is composed of four key parts:
- Revenue
- Gains
- Expenses
- Losses
Let’s break these down so they’re as easy to digest as your morning coffee.
Revenue
Revenue is the lifeblood of your business—the money you earn from selling your products or services. It’s the top line on your income statement because, well, it all starts here. Without revenue, you’ve got a hobby, not a business.
Operating Revenue
Operating revenue comes from your main business activities. If you run a bakery, this is the dough (pun intended) from selling pastries and bread. It’s the core reason your business exists.

Non-Operating Revenue
Non-operating revenue is like finding a $20 bill in your old coat—unexpected but welcome. It comes from secondary activities, like:
- Interest earned from a savings account.
- Rental income from extra office space.
- Income from royalties or patents.
These aren’t your main gig, but they add some extra cash to your pocket.
Revenue vs. Receipts: What’s the Difference?
Don’t confuse revenue with receipts. Revenue is recorded when you earn it, not necessarily when you get paid. Receipts are recorded when the cash actually hits your account. So, if you invoice a client in June but they pay in July, the revenue is recorded in June, but the receipt is in July.
How Is Revenue Calculated?
The formula is straightforward:
Revenue = Number of Units Sold × Selling Price per Unit
Sell 100 widgets at $50 each? That’s $5,000 in revenue. Cha-ching!
Cost of Goods Sold (COGS)
Cost of Goods Sold represents all the direct costs involved in producing your product or service. Think materials, direct labor, and manufacturing overhead. It’s like the secret ingredient list for your product.
Calculating COGS
Here’s the formula:
COGS = (Beginning Inventory + Purchases During the Period) – Ending Inventory
It’s like a before-and-after snapshot of your inventory, adjusted for any new stuff you bought.

Gross Profit
Time for the magic number:
Gross Profit = Total Revenue – Cost of Goods Sold
This tells you how much money you’re making after covering the costs to produce your goods or services. If this number isn’t positive, you’ve got a problem bigger than deciding between latte or cappuccino.
Gross Profit Example
Let’s say you own Tech Gadget Co., and you sold 100 laptops at $1,000 each. The cost to produce each laptop (COGS) is $700.
- Total Revenue: 100 × $1,000 = $100,000
- COGS: 100 × $700 = $70,000
- Gross Profit: $100,000 – $70,000 = $30,000
Not too shabby!
Gains and Losses
Gains are like bonus points—extra money from activities outside your main operations. Maybe you sold an old company car for more than its book value. Sweet!
Losses are the opposite—unexpected costs or money lost from non-core activities. Think lawsuits, natural disasters, or selling an asset for less than its value. Ouch.
Expenses in Income Statements
Expenses are the costs required to run your business (and no, you can’t expense your daily triple espresso). They include things like salaries, rent, utilities, and marketing.
Operating Expenses
These are the day-to-day costs of keeping the lights on:
- Selling, General, and Administrative Expenses (SG&A): Office supplies, salaries, insurance—everything that doesn’t involve making the product.
- Research and Development (R&D): Money spent innovating new products or improving existing ones. Because staying ahead of the curve isn’t cheap!
Operating Income
Operating Income shows the profit from your core business operations:
Operating Income = Gross Profit – Operating Expenses
This figure tells you how well your business is performing before interest and taxes. If this number is positive, you’re on the right track!
EBITDA: Earnings before interest, taxes depreciation, and amortization
EBITDA is the Earnings before interest, depreciation, taxes, and amortization.
The EBITDA on an income statement is calculated by finding the difference between the gross profit and the selling, general and administrative expenses (SGA).
Depreciation and Amortization
Depreciation is the gradual loss of value of tangible assets (like equipment), while amortization is for intangible assets (like patents). Recording these costs spreads out the expense over the asset’s useful life. It’s like acknowledging that your company car isn’t going to run forever.
Depreciation Example
Let’s say you buy a delivery van for $30,000, and you expect it to last 10 years with a salvage value of $5,000. Using straight-line depreciation:
Annual Depreciation Expense = (Cost – Salvage Value) / Useful Life
So:
($30,000 – $5,000) / 10 = $2,500 per year
That’s $2,500 you record as an expense each year.
Interest Expense
If you’ve borrowed money, interest expense is the cost of carrying that debt. It’s calculated as:
Interest Expense = Total Debt × Interest Rate
For example, if you have a $50,000 loan at a 5% interest rate:
$50,000 × 0.05 = $2,500 annual interest expense
Income Tax Expense
Income tax expense is the amount you owe the tax authorities. It’s based on your taxable income, which isn’t always the same as your net income due to tax laws (because why make it simple?).
Net Income
Drumroll, please! The Net Income is the bottom line—literally. It’s what’s left after subtracting all expenses, including taxes and interest, from your total revenue.
Net Income = (Total Revenue + Gains) – (Total Expenses + Losses + Income Tax)
This is the number investors and creditors zero in on. A positive net income means you’re profitable. Negative? Time to revisit your business plan.

Discontinued Operations
If you’re planning to sell or shut down a part of your business, that’s considered discontinued operations. Any gains or losses from this are reported separately on the income statement. It’s like saying, “By the way, we’re closing our muffin division.”
Examples of Income Statements from Popular Companies
Enough theory—let’s look at some real-world examples. (Note: Insert images where indicated.)
Nike Income Statement
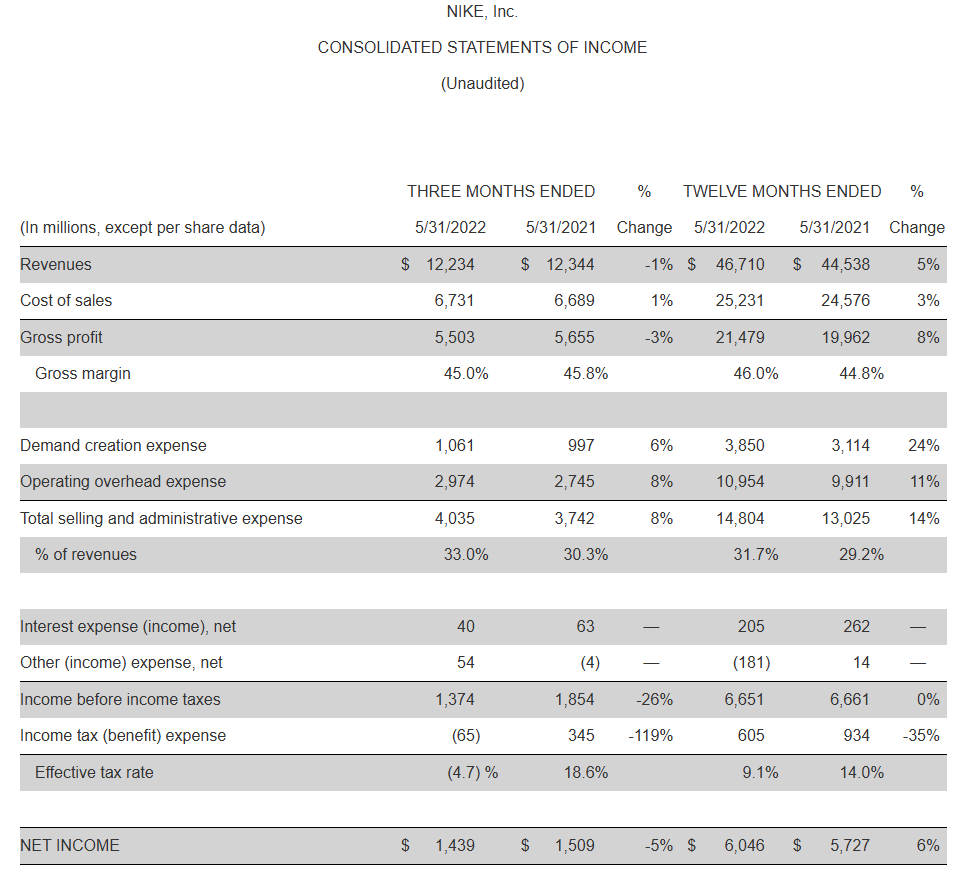
Nike’s income statement highlights its revenues from global footwear and apparel sales, minus COGS and operating expenses, to reveal its net income.
Source: Nike
Starbucks Income Statement
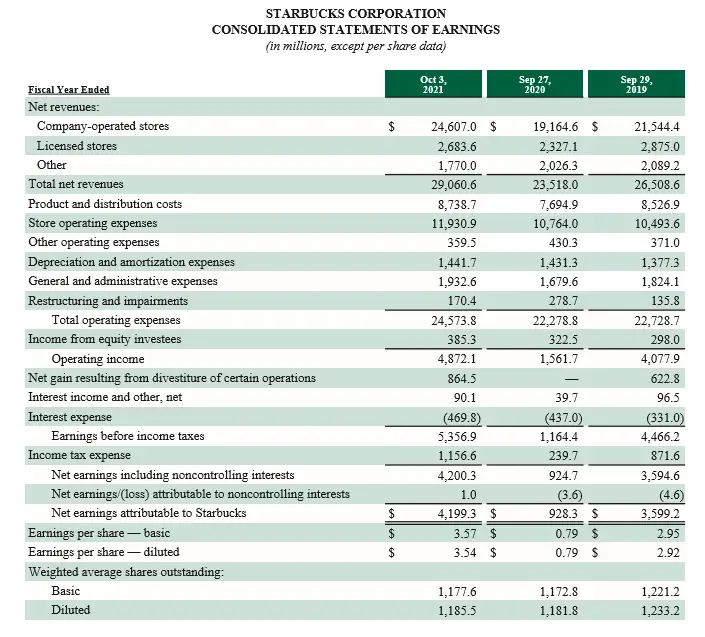
Starbucks’ income statement showcases revenues from its coffee empire, deducting operating expenses to present its net profit.
Source: Starbucks
The Importance of the Income Statement
Why is this document such a big deal? Here’s the scoop:
Assess Profitability: It shows whether you’re making money or bleeding cash.
Compare Performance: You can stack your income statement against competitors’ to see who’s the top dog.
Inform Strategy: Helps management decide where to cut costs or invest more.
Investor Attraction: A healthy income statement can lure investors like bees to honey.
Limitations of the Income Statement
It’s not all sunshine and rainbows, though:
Estimates and Assumptions: Some figures are based on estimates, like depreciation, which can be manipulated.
Excludes Certain Revenues and Expenses: Not all financial activities are recorded here, like unrealized gains or losses.
Connecting the Income Statement and Balance Sheet
Wondering how these two financial statements play together?
The net income from the income statement affects the equity on the balance sheet. Specifically, net income increases retained earnings, a component of shareholders’ equity. Think of the income statement as the action movie and the balance sheet as the snapshot at the end credits.
Takeaways
The income statement is your roadmap to financial success. It tells the story of your business’s performance over a period, highlighting where you’re crushing it and where you might need a little TLC.
So, grab that income statement, pour yourself a cup of coffee (or something stronger), and dive into the numbers. Your future, wealthier self will thank you.