
Can Your Business Actually Afford Its Debt? The Interest Coverage Ratio Spills the Tea
Let’s talk about debt. It’s the financial equivalent of that one friend who crashes on your couch “for a few days” and is still there six months later. Having some can be a strategic move for growth, but too much of it, and you’re drowning in IOUs.
The interest coverage ratio (ICR), sometimes called the times interest earned ratio, is the brutally honest friend you need. It’s a simple financial metric that cuts through the BS to answer one question: can your company comfortably pay the interest on its debt, or is it about to get a visit from the repo man?
Think of it as a financial stress test. It measures how many times over a company’s operating profit can cover its interest payments. It’s a direct look at your company’s ability to handle its obligations before things get messy.

Why Should You Give a Damn About the ICR?
This isn’t just another piece of financial jargon to ignore. The ICR is a vital sign of your company’s health, and everyone from your banker to your investors is watching it.
- Lending Risk Assessment: Before a creditor hands you a pile of cash, they want to know you can pay them back. A high ICR screams “low-risk borrower,” while a low one has them clutching their pearls. According to financial analyses, lenders often look for an ICR of at least 1.5 to 2.0 as a baseline for financial stability.
- Financial Health Indicator: A consistently healthy ICR shows you’re a pro at managing debt. But a declining ratio? That’s a red flag waving in the wind, signaling that financial trouble might be brewing.
- Short-Term Reality Check: Forget five-year plans for a second. The ICR tells you what’s happening right now. It offers a clear snapshot of your immediate financial stability and whether you have enough cash flow to keep the lights on and the debt collectors at bay.
The Not-So-Secret Interest Coverage Ratio Formula
Ready to do some math? Don’t worry, it’s easier than assembling IKEA furniture.
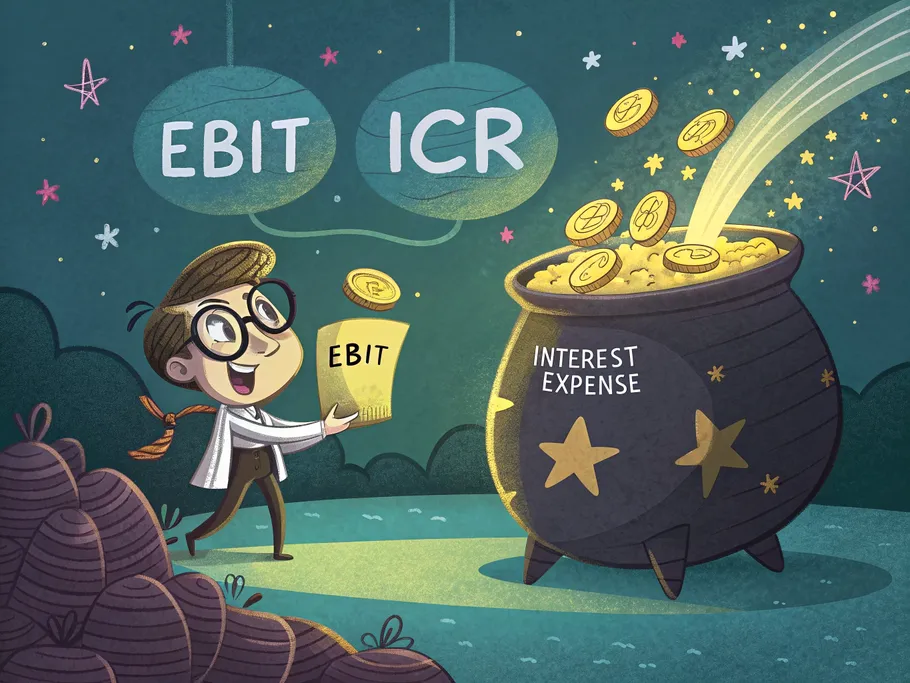
Interest Coverage Ratio = EBIT / Interest Expense
Let’s break that down:
- EBIT: This stands for Earnings Before Interest and Taxes. It’s the profit your company makes from its core operations, ignoring the pesky details of interest and taxes. It’s a pure look at your operational performance.
- Interest Expense: This is the total amount you owe on all your borrowings – think loans, bonds, and that maxed-out company credit card.
Interest Coverage Ratio Interpretation: Good, Bad, and Ugly
So you’ve got your number. What does it actually mean?
A Higher Interest Coverage Ratio is Your Friend
- A ratio greater than 1.0 means you’re in the clear… for now. Your earnings can cover your interest payments.
- A ratio of 1.5 is generally seen as the minimum acceptable level. You’re not thriving, but you’re surviving.
- A good interest coverage ratio is typically 2.0 or higher. This tells investors and lenders that you have a comfortable cushion and can handle your debt without breaking a sweat.
A Lower Interest Coverage Ratio is a Cry for Help
- A ratio below 1.0 is a full-blown emergency. Your earnings aren’t even enough to cover your interest payments. This is how defaults happen.
- A ratio below 1.5 should have you on high alert. It raises serious questions about your ability to make payments consistently, especially if your revenue takes a hit.
Investors don’t just look at a single number; they watch the trend. An ICR that’s on the rise shows you’re getting better at managing debt. A falling ICR suggests you’re heading for a cliff.
Let’s Calculate the Interest Coverage Ratio: Examples
Company A Example
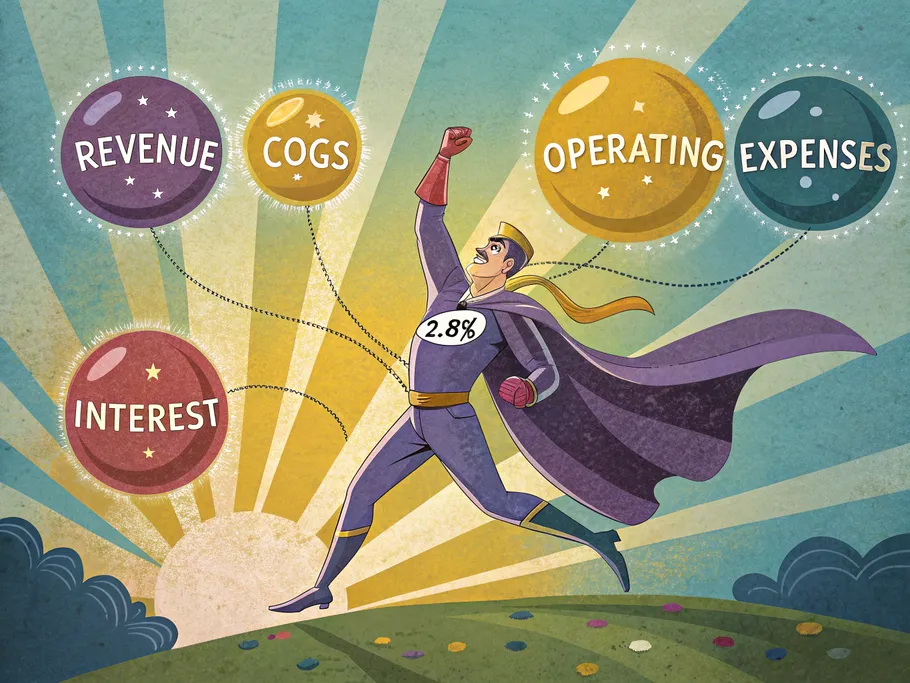
Company A has total revenue of $10,000,000, COGS of $500,000, and operating expenses of $120,000 (salaries), $500,000 (rent), $200,000 (depreciation), and $100,000 (other operating expenses). The interest expense is $3,000,000.
A Solution:
- EBIT Calculation: EBIT = $10,000,000 – $500,000 – $120,000 – $500,000 – $200,000 – $100,000 = $8,580,000
- Calculate ICR: ICR = $8,580,000 / $3,000,000 = 2.86x
Company A can cover its interest payments 2.86 times with its operating profit. Not bad at all.
Just Company Example
A company earns $750,000 in EBIT per quarter and owes $240,000 in debt every six months.
Just Company Solution:
- Calculate quarterly interest expense: $240,000 / 2 = $120,000
- Calculate ICR: ICR = $750,000 / $120,000 = 6.25x
This is a very strong debt coverage ratio.
Company X Example
Company X applies for a loan with multiple borrowings having interest expenses of $1,700, $1,500, and $2,000, and EBIT of $15,000.
X Solution:
- Calculate total interest expense: $1,700 + $1,500 + $2,000 = $5,200
- Calculate ICR: ICR = $15,000 / $5,200 = 2.88x
This reassures lenders that the borrower can handle their interest payments.
Jane’s Jam Company Example
Jane’s Jam Company earns $50,000 in EBIT with interest expenses of $15,000.
Jane’s Jam Solution:
ICR = $50,000 / $15,000 = 3.33x
Jane’s company can cover its interest payments 3.33 times over.
ABC Company Example
ABC Company earns $5,000,000 in EBIT with interest expense of $2,500,000.
ABC Solution:
ICR = $5,000,000 / $2,500,000 = 2.1x
ABC’s earnings are sufficient to cover interest expenses with a decent safety margin.
Tweaking the Formula: Variations of the ICR
Not all ICRs are created equal. You might see a few different flavors out in the wild.
EBIT (Earnings Before Interest and Taxes) This is the classic, no-frills version. It focuses purely on operating performance by stripping out interest and tax effects.
EBITDA (Earnings Before Interest, Taxes, Depreciation, and Amortization) The EBITDA interest coverage ratio adds back non-cash expenses like depreciation and amortization. This usually results in a higher, more flattering ICR because it’s a better proxy for cash flow. Some love it, some call it cheating.
EBIAT (Earnings Before Interest and After Taxes) This version gets conservative by deducting taxes from the earnings. It shows what’s left to pay interest after Uncle Sam takes his cut, giving a more realistic picture of available cash.

So, What’s the Point? Uses of the ICR
- Assess if a company can actually service its debt.
- Help creditors and investors gauge lending risk.
- Measure a company’s financial stability and creditworthiness.
- Analyze short-term liquidity and cash flow.
- Track whether a company is getting better or worse at managing its debt over time.
The Fine Print: Limitations of the ICR
Before you bet the farm on this one metric, remember that it has its blind spots.
- Industry Variations: A “good” ICR in one industry could be a disaster in another. A utility company might be perfectly stable with a ratio of 2.0, while a manufacturing company with cyclical sales might need a 3.0 or higher to be considered safe.
- Unexpected Events: The real world is messy. Economic downturns, pandemics, or market disruptions can wreck a company’s earnings and send its ICR plummeting overnight.
- Debt Exclusions: Calculating your ICR by conveniently excluding certain debts? That’s not financial health, buddy; that’s just strategic forgetting. Always dig into the details to see which obligations are included in the reported numbers.