
Demystifying ROE: A Startup’s No-BS Guide to Return on Equity
Alright, startup warriors and financial newbies, gather ’round! Ever wondered what that mystical ROE everyone keeps talking about is? Spoiler alert: it’s not a sci-fi term. Return on Equity (ROE) is your ticket to understanding how well your company is turning investments into cold, hard cash.
In plain English, ROE measures how effectively your business uses the money invested by shareholders to generate profits. Think of it as the ultimate report card for your company’s financial efficiency. And trust me, investors are obsessed with it.
Speaking the Language of Investors
Picture this: You’re at an investor pitch, and instead of fumbling over buzzwords, you drop a solid ROE figure. Boom! Instant attention. A high ROE screams, “We know how to make money work for us!” Investors love when their dollars multiply, and a healthy ROE tells them you’re not just playing business—you’re in it to win it.
Not Just for the Big Players: Think ROE is only for Wall Street wolves and Fortune 500 giants? Think again. For startups and small businesses, ROE is like a financial GPS. It tells you where you are, where you’re headed, and if there’s a cliff up ahead.
For you hustling entrepreneurs out there, a solid ROE means you’re using your resources wisely and your business has its act together. On the flip side, a low or negative ROE is like a flashing red warning sign saying, “Danger ahead! Time to pivot or sink.”
Formula and Calculations
Alright, math hat time. Don’t worry; it’s simpler than splitting a bill after a team dinner.
ROE = Net Income ÷ Average Shareholders’ Equity
Key Components:
- Net Income: This is your profit after you’ve paid all the bills, taxes, and bought that fancy office coffee machine. It’s the “bottom line” on your income statement. Basically, what’s left in your pocket after everyone else has taken their slice.
- Average Shareholders’ Equity: Also known as owners’ equity, it’s what’s left when you subtract liabilities from assets. It represents the total value that’s been invested in your company by shareholders. To get the average, add the equity at the beginning and end of the period and divide by two. Easy peasy.
Think of it this way: If your company were a pizza, shareholders’ equity is the amount of pizza your investors own. ROE tells you how much extra pizza (profits) you’re making from their slice.
Examples
Example 1: Let’s say you’re running a tech startup that just secured $200,000 in funding. After one year, you report a net income of $50,000. If you had $100,000 in equity before the funding and $300,000 after, your average shareholders’ equity is:
Average Shareholders’ Equity = ($100,000 + $300,000) ÷ 2 = $200,000
Now, plug into the ROE formula:
ROE = $50,000 ÷ $200,000 = 0.25 or 25%
Translation: For every dollar of equity, you’re generating 25 cents in profit. Not too shabby!
Example 2: Suppose your startup snagged $5,000,000 in funding, bringing total equity to $8,000,000. After a year, your net income is $1,200,000.
ROE = $1,200,000 ÷ $8,000,000 = 0.15 or 15%
So, you’re turning each dollar of equity into 15 cents of profit. Investors will find that interesting, especially if the industry average is lower.
Example 3: You’re a solopreneur who invested $1,000,000 into your business. Over the past year, you’ve earned a net income of $200,000.
ROE = $200,000 ÷ $1,000,000 = 0.20 or 20%
You’re earning 20 cents for every dollar invested. Now, if you reinvest an additional $500,000 (making total equity $1,500,000) and next year’s net income is $300,000:
ROE = $300,000 ÷ $1,500,000 = 0.20 or 20%
Even with more investment and higher income, your ROE stays at 20%. It means you’re consistently efficient at turning equity into profit. Steady as she goes!
Interpreting ROE: The Good, the Bad, and the Misleading
ROE can be a powerful tool, but like any tool, it’s all about how you use it. Let’s dive into the nuances so you don’t get blindsided.
Industry Benchmarks: A Reality Check
Comparing your ROE to companies in different industries is like comparing apples to, well, laptops. It doesn’t make sense!
For instance, tech companies often have higher ROEs because they can scale quickly without massive capital investments. Think software that can be sold endlessly with minimal extra cost. On the other hand, utility companies might have lower ROEs due to heavy infrastructure costs and regulations.
Example: A tech company has an ROE of 25%, and a utility company sits at 10%. Before you start bragging, consider that in tech, 25% might be average, whereas 10% in utilities could be stellar.
The takeaway? Always compare your ROE to industry peers to get a meaningful picture. Don’t pat yourself on the back—or panic—without proper context.
The Debt Dilemma
Beware the dark side of debt. High levels of debt can make your ROE look like it’s on steroids. Why? Because debt reduces shareholders’ equity, making the ROE ratio higher even if net income hasn’t skyrocketed.
For example: Company A has a net income of $100,000 and equity of $50,000. ROE? A whopping 200%. But if they’re drowning in debt, that high ROE might be a mirage.
Meanwhile, Company B has a net income of $80,000 and equity of $200,000, giving an ROE of 40%. They might be the tortoise in this race—steady and with less risk.
Moral of the story: Don’t get seduced by high ROE without checking the company’s debt levels. Always look at the debt-to-equity ratio to see the full picture.

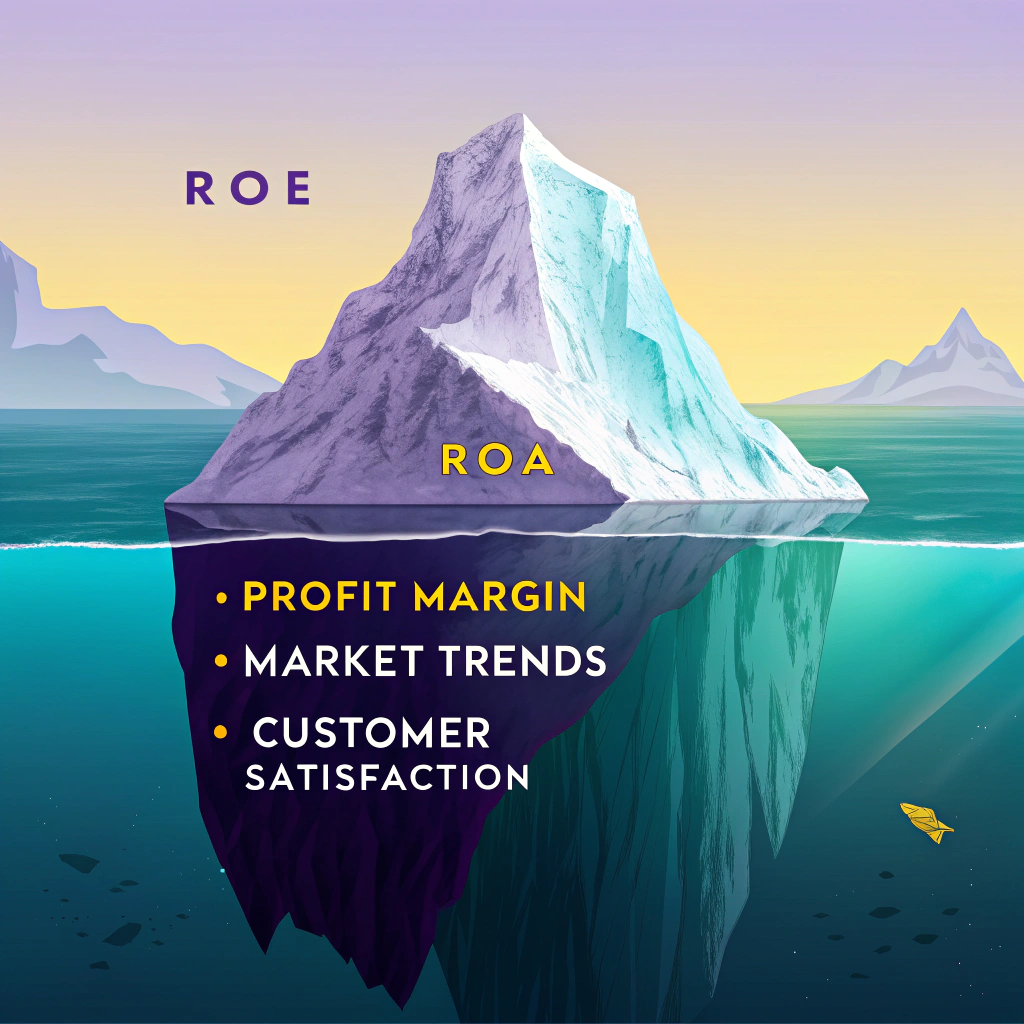
Beyond the Numbers: A Holistic View
ROE is like the trailer to a movie—it gives you a glimpse but not the whole story. For the full feature, consider other financial metrics:
- Return on Assets (ROA): Measures how efficiently you use all assets to generate profit.
- Profit Margin: Shows how much profit you keep per dollar of revenue.
- Growth Rates: Tracks how quickly your revenue and earnings are increasing.
Also, factor in qualitative elements like market trends, customer satisfaction, and competitive landscape. Numbers are important, but they’re not everything.
ROE in Action: Practical Applications for Startups
Sustainable Growth vs. Short-Term Gains
A sky-high ROE can be tempting, but ask yourself: Is it sustainable? Cutting corners to boost profits might inflate your ROE now but could hurt you later.
Example: Slashing R&D spending might improve net income today but leave you without innovative products tomorrow. It’s like eating all your seeds instead of planting them for a future harvest.
The smart move? Focus on strategies that improve ROE without mortgaging your future. Invest in areas that promote long-term growth, even if it means your ROE grows steadily rather than shooting through the roof overnight.
Attracting and Reassuring Investors
Investors aren’t just throwing darts at a board—they’re looking at metrics like ROE to make decisions.
Tip: When pitching, highlight your solid ROE and, more importantly, explain how you achieved it. Transparency builds trust.
Example: “Our ROE is 30%, achieved through efficient operations and a strong focus on customer retention, not just cost-cutting.”
Show them that your impressive numbers are due to smart strategies, not accounting tricks or excessive risk-taking.
Navigating Economic Uncertainty
Economic ups and downs can mess with your ROE. Inflation, interest rates, and market shifts all play a role.
Action Steps:
- Stay Agile: Be ready to adjust your business model as needed.
- Manage Costs: Keep an eye on expenses that could erode your net income.
- Watch Debt Levels: Rising interest rates can make debt more expensive, impacting your bottom line and ROE.
Remember, a resilient business isn’t just about high returns—it’s about surviving and thriving in any economic weather.
Beyond ROE: Expanding Your Financial Toolkit
While ROE is a superstar, it’s not a solo act. To truly understand your company’s financial performance, you need a full band of metrics.
ROA vs. ROE: Understanding the Difference
Return on Assets (ROA): This measures how efficiently you’re using all assets—both debt and equity—to generate profits.
Formula: ROA = Net Income ÷ Total Assets
The Key Differences:
- ROA Includes Debt: Gives you a sense of how well you’re using everything at your disposal, including borrowed funds.
- ROE Focuses on Equity: Shows how well you’re generating profit from investors’ money.
Watch Out: A high ROE but low ROA could mean you’re heavily leveraged with debt. That’s like running fast on thin ice—exciting but risky.
The Rise of Intangible Assets
In today’s digital world, not all assets are tangible. Think of brand value, patents, or that secret sauce in your algorithm. Traditional ROE calculations might not capture these gems.
Example: A software startup’s true value might be in its proprietary code, which isn’t fully reflected on the balance sheet. So, while ROE is helpful, it might not tell the whole story.
Tip: Supplement ROE analysis with other methods that factor in intangible assets, like intellectual capital reports or brand valuation models.
From Analysis to Action
Numbers are great, but what you do with them matters more. Use your ROE insights to steer your business in the right direction.
Action Steps:
- Set Clear Goals: Know what ROE targets make sense for your industry and stage of growth.
- Monitor Regularly: Keep tabs on your ROE and other key metrics to spot trends early.
- Make Informed Decisions: Use this data to guide investments, cut unnecessary costs, or pivot strategies.
- Balance Risk and Reward: Be mindful of how debt impacts your ROE and overall financial health.
Takeaways
- ROE is a crucial metric that shows how effectively you’re using shareholders’ equity to generate profits.
- Context Matters: Always compare your ROE to industry benchmarks and consider factors like debt levels.
- Balance Short-Term Gains with Long-Term Stability: Don’t sacrifice future growth for immediate ROE boosts.
- Use ROE Alongside Other Metrics: Include ROA, profit margins, and growth rates for a complete financial picture.
- Action-Oriented: Let ROE guide your strategic decisions but don’t let it be the sole navigator.
Remember, understanding and leveraging ROE can be your secret weapon in building a successful, sustainable business. Now go forth and conquer the financial world—or at least impress your investors at the next meeting!